狮山巡礼
投资杂谈


Based on the SystemTrader dashboard from May 8, 2026, the VIX Term Structure is currently in a state of Contango, which historically aligns with your observation of higher prices ahead.
Current Market Signal (May 8, 2026)
The Implied Volatility Term Structure (IVTS) ratiocalculated as VIX / VIX3Mis currently 0.8375.
Contango Confirmation: Since the ratio is well below 1.0, the market is in a normal calm-market regime. This has been the case for 23 consecutive days.
Volatility Pricing: Spot VIX is at 17.16, while the 3-month VIX (VIX3M) is higher at 20.49. This upward-sloping curve suggests that investors are not paying a premium for immediate protection, indicating low near-term stress.
Historical Context Price Correlation
The IVTS Signal chart shows a clear relationship between these volatility regimes and the SPY price:
Buying the Spikes: You can see that previous instances where the blue line crossed above the 1.0 (Backwardation) or 1.01 (Stress Threshold) red dashed lines coincided with sharp dips in the SPY (the grey line).
The Recovery Phase: As the blue line retreats from those peaks and settles back into the lower blue zone (Contango), the SPY has consistently resumed its upward trajectory.
Current Trend: The ratio is currently trending near the lower end of its historical distribution for the last two years, suggesting a high degree of market stability.
有关这方面知识:
The VIX Term Structure is indeed one of the most reliable macro-technical signals for judging when market stress is peaking or when a recovery is likely. Since you apply a Double-Scale methodology, you likely view this through the lens of timing: determining when the technical signal aligns with the long-term fundamental quality of your holdings.
When the VIX Term Structure shifts, it usually signals a change in the equity risk premium. Here is a breakdown of how the curves shape typically translates to price action.
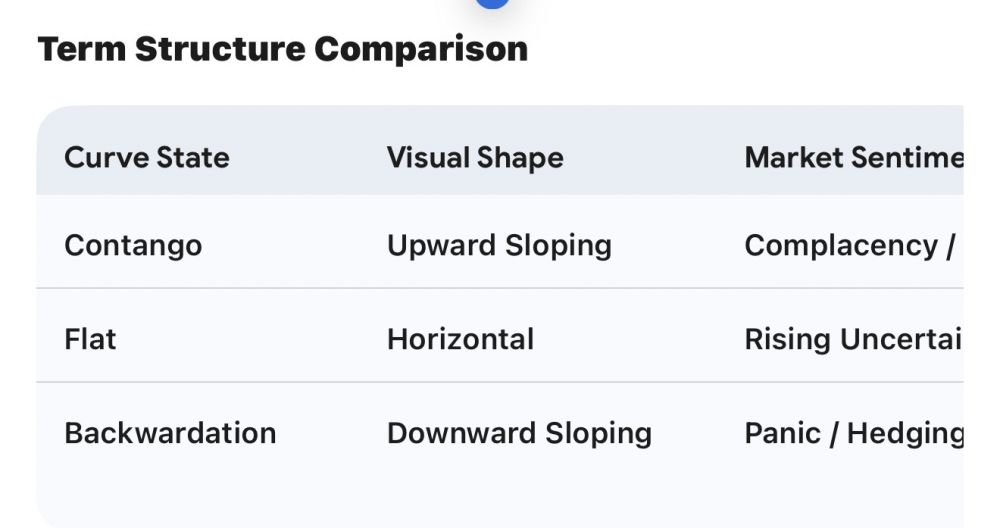
1. Contango (The Default State)
In a healthy, trending bull market, the curve is in contango (upward-sloping). Longer-dated futures (\bm{F_2, F_3, \dots}) are priced higher than the spot VIX or front-month futures (\bm{F_1}).
The Signal: This reflects a business as usual environment. While it suggests stable or rising equity prices, it also means the roll yield for short-volatility strategies is positive.
Actionable Context: For a long-term investor, this is the time to let winners run. However, if the contango becomes extremely steep, it can occasionally signal complacency.
2. Backwardation (The Panic Signal)
When the curve invertsmeaning spot VIX and near-term futures are higher than long-term futuresthe market is in backwardation.
The Signal: This indicates immediate, front-loaded fear. Investors are scrambling for protection now, but they expect the chaos to be temporary and mean-revert in the future.
Historical Accuracy: Deep backwardation has historically been a strong contrarian indicator. When the front-month premium spikes significantly above the back months, it often marks a local washout in equities.
3. The Roll-Back into Contango
The most potent signal for higher prices ahead isnt necessarily the inversion itself, but the transition from backwardation back into contango.
The Trigger: When the spot VIX crosses back below the front-month and second-month futures, it suggests the volatility storm has broken.
Equity Impact: This volatility crush (IV crush) leads to buying pressure as dealers hedge their positions and systematic volatility-targeting funds re-leverage into the market.